Some Thoughts on Teaching "Interactive Data Visualization"
Lynn Cherny
Visiting Knight Chair, Univ of Miami
2015-2016


Required Background
Web Design: HTML, CSS
Recommended Background
Some Javascript experience

They Come in Knowing....
https://jsfiddle.net/v7k1u49h/1/
The Javascript Part : "interaction."
https://jsfiddle.net/v7k1u49h/1/
What is the teaching goal?
NYT-Level
Custom Work
Clickable
images
1
10
Use a chart
library
3
Photoshop,
Illustrator
Highcharts
D3.js
Custom
code
5
D3.js, WebGL,
Canvas...
"Custom" Code
d3.selectAll("rect")
.attr("fill", function(d) {
if (d.name == "United States") {
return "red";
} else {
return "black";
}
});
Portfolio Material

Using github and bl.ocks.org viewer for homework
http://bl.ocks.org/yan2014
Student Projects


Most successful: Factors External to my control
- Had some programming experience previously
- Had good design chops (visual, especially)
- Chased a data story well: Expertise in data exploration, tools
- Did extra work -- external data, used libraries or tools, tried new things
- Had enough time to spend on doing it well
The best students....
Teaching Challenges
- Debugging student problems ALL THE TIME
- Doesn't scale!
- There are no qualified TAs, really.
- Email debugging is really hard/time consuming
- Homeworks: Time-consuming to grade, but you need to give a lot. (Every week, usually multiple.)
- Time for projects vs. course content: Ideally, could have been 2 semesters (basics, then a project semester)
- Data mining / analysis: Not in the course, but a critical skill pre-visualization.
Unexpected Pluses
- Very, very motivated students
- Lots of women students in a programming class
- Insufficient web dev classes at the university -- we can fill in the gaps
- Non-journalism students are now interested in visual data journalism (MFA students this semester)
- This skill translates to a lot of jobs, not just newsrooms
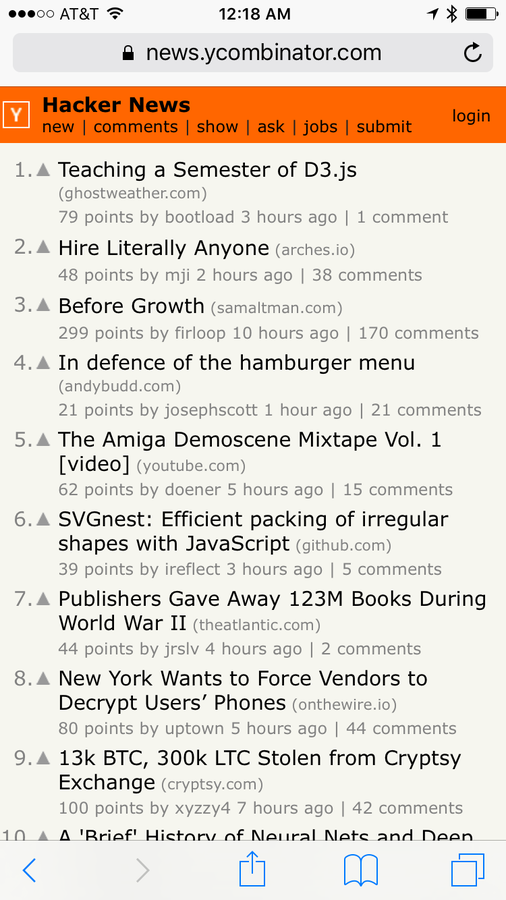
"Teaching a Semester of D3.js"
http://blogger.ghostweather.com/2016/01/teaching-semester-of-d3js.html

Blog post Went to #1 on Hacker News (Freakishly?)

And it's now being translated for a Chinese data journalism site...
The Materials (on Github)

http://arnicas.github.io/interactive-vis-course/
Last semester:
"Best class ever!"
This semester (week 5/15):
"It's hard, but it's also kind of fun"
"I think I want to do a data visualization project for my capstone"
—a non-journalism student
Teaching this stuff is important, and
hard, but also...
It's actually possible.


http://www.nytco.com/amanda-cox-named-editor-the-upshot/
ghostweather.slides.com/lynncherny
lynn@cherny.com
Teaching Interactive Data Vis
By Lynn Cherny
Teaching Interactive Data Vis
- 5,440


